Logging User Guide
Loki is a log collection application that works with Grafana to display collected log data from multiple data sources. Data sources can reside on one or more than one system and be collected from one or more log files within each system. Loki uses tagging on the ingestion of data in order to help organize the data streams.
Loki also builds upon common Grafana tools like date-time range manipulation and graphical representations of data that anyone familiar with the Prometheus/Grafana stack would immediately recognize. This helps the end user dive in and begin mining logs very quickly.
Additionally, log searches that the end user may find useful, for example, eliminating WARNINGs or only showing ERRORs can be saved to dashboards for later use. This is common to dashboarding in Grafana, and once again, familiarity with that tool lends familiarity with Loki.
Test System
The test system can be found here : http://10.64.198.27:32320/
Getting Started - Log Querying 101
First Steps - I’m Here, What Do I Do?
Start with the “hamburger menu” in the top left corner of the screen and select “Explore”. This will take the user to the main query builder window.
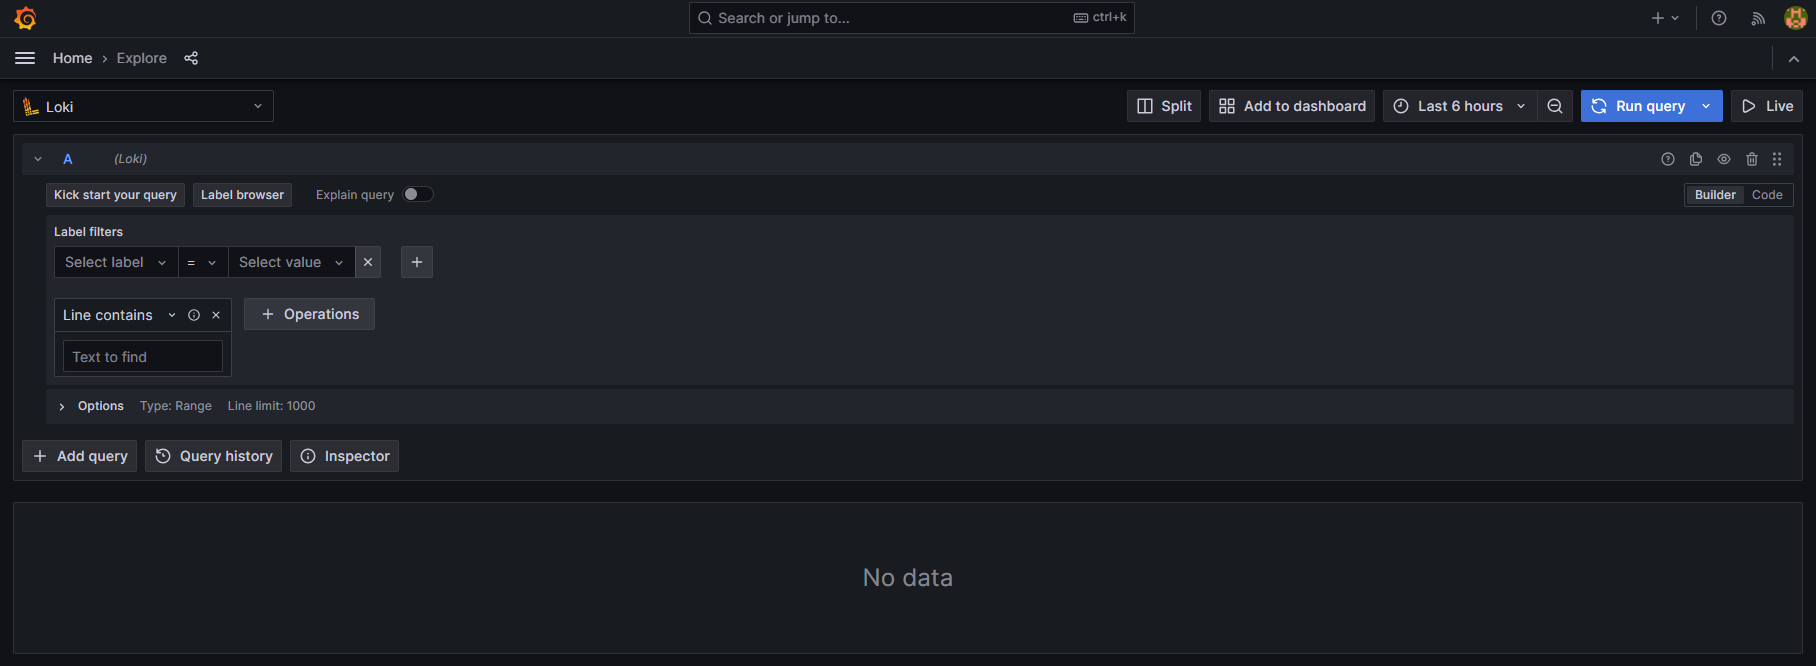
Making Your First Simple Query
In “Select Label” select “Job”. This will give you the main list of systems that are feeding Loki.
For our example we will select “calvera-galaxy”, because this is a chatty system with some interesting data.
Hit “Run Query” in the top right corner and we will see a lot of output.
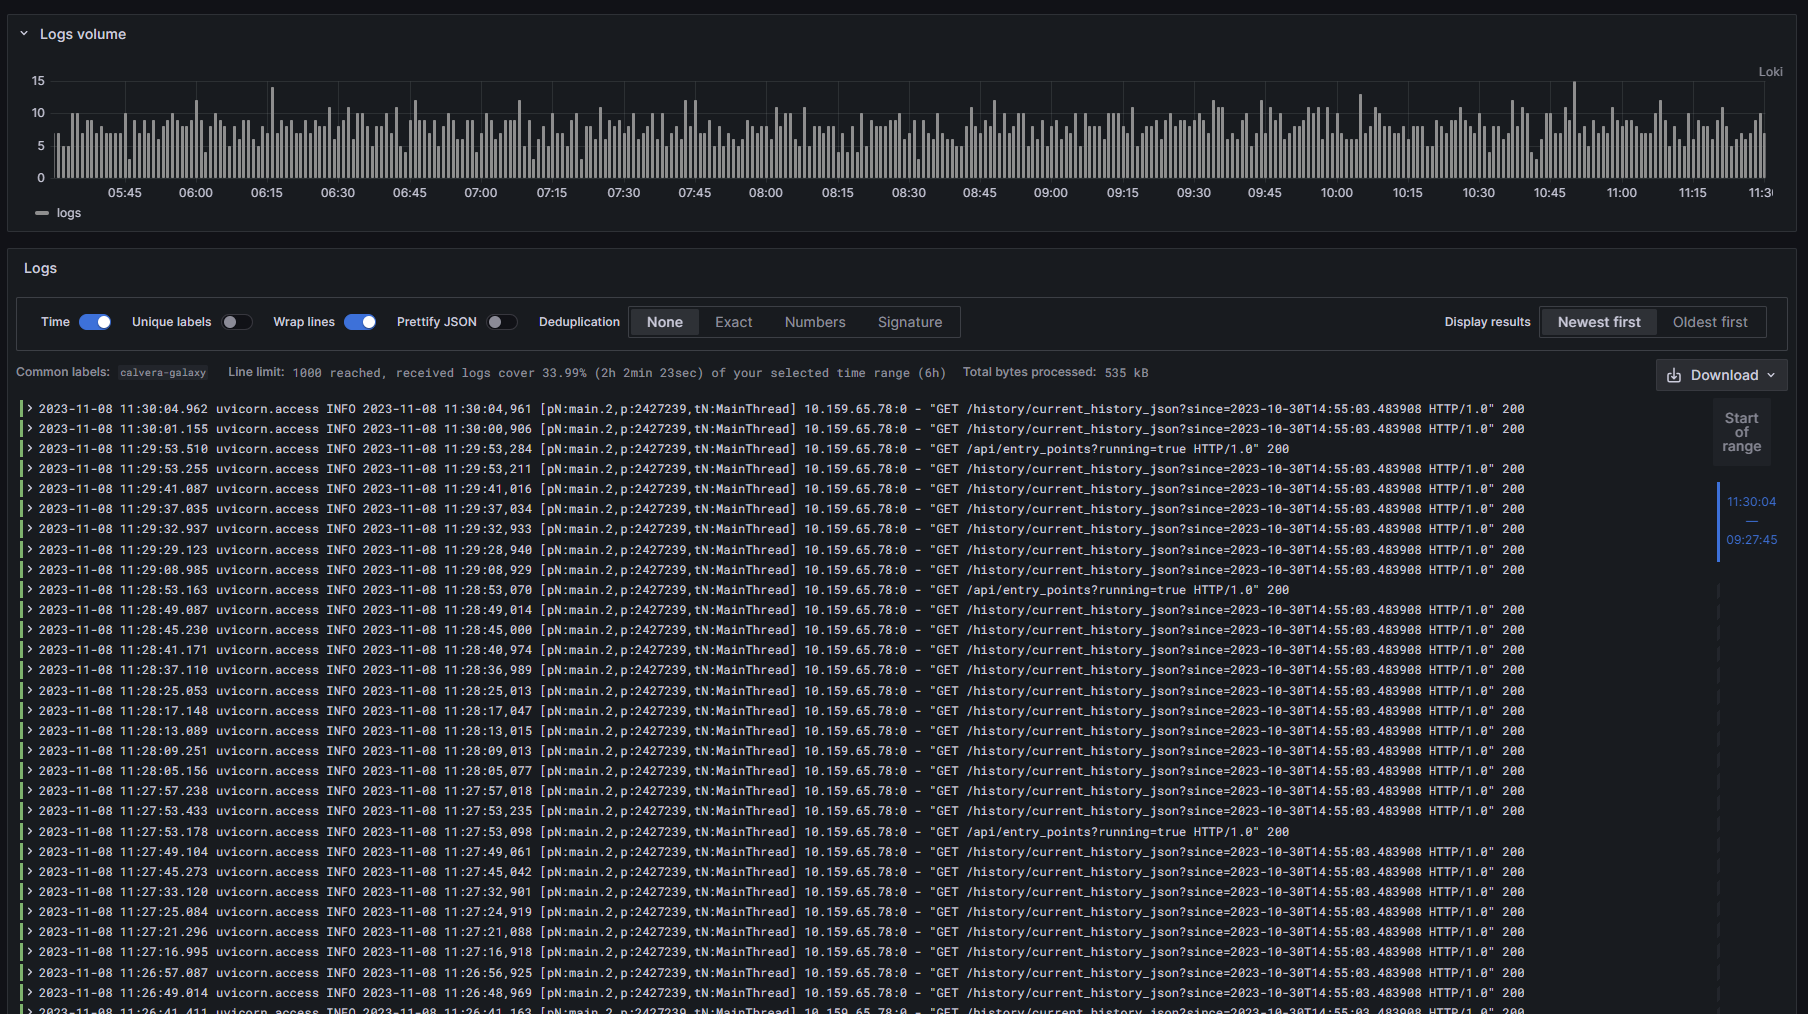
We can see that the output is giving us data from the last 6 hours and we can see a graphical representation of how much data we got for the given time periods. We can also see that uvicorn is a log-heavy application.
Let’s filter that out.
Filtering Data
Right below where we started our query, we see “Line Contains”. Select that, and use the pulldown to use “Line Does Not Contain”. In the text field below, add “uvicorn.access”. This will filter out all the access log lines that are not currently interesting to us.
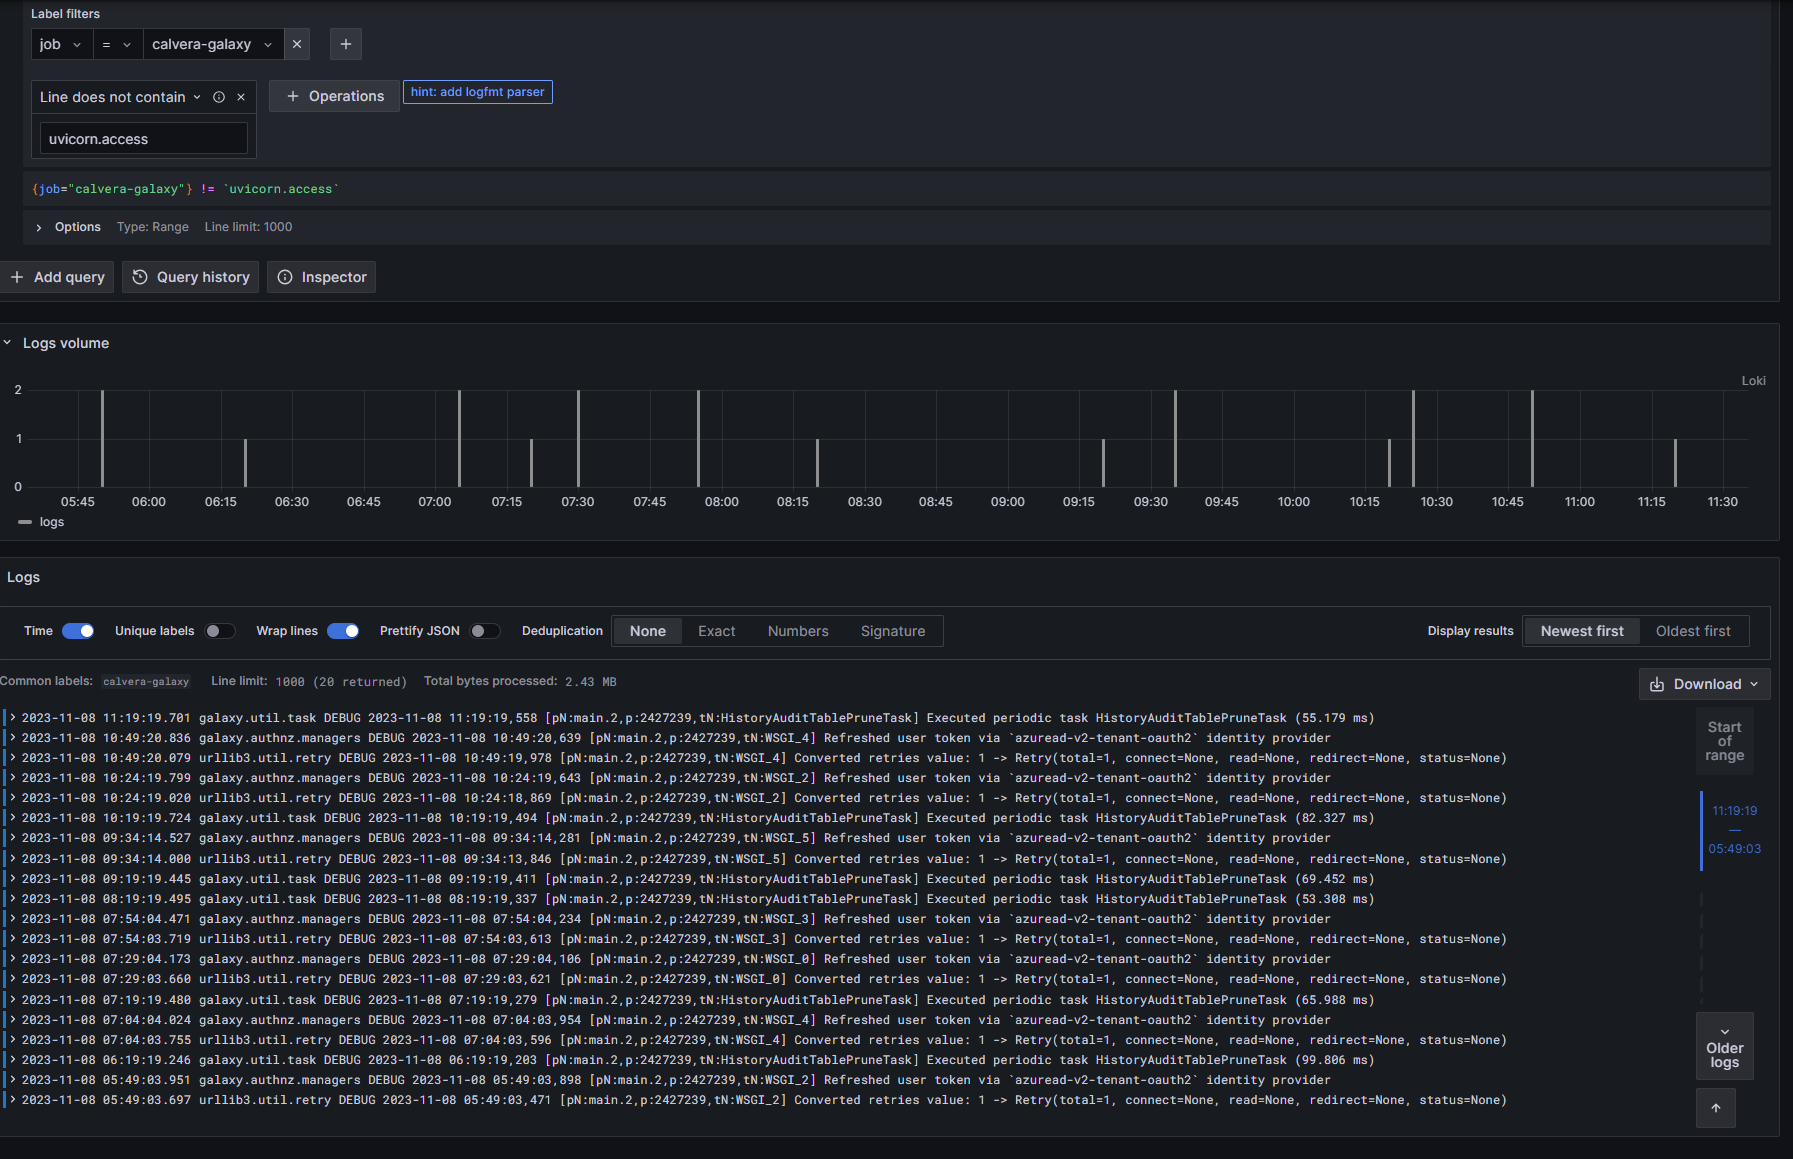
As you can see in Fig 3, there is a lot less data to sift through, and we see Galaxy was running some DEBUG lines periodically.
Adding Additional Logs to Your Output
It is often useful, when debugging issues across a complex system to include logs from more than one system. Let’s add another log.
Hit “Add Query”.
Once again, select “Job”, and this time add “cloud1-pulsar”.
Hit “Run Query” again.
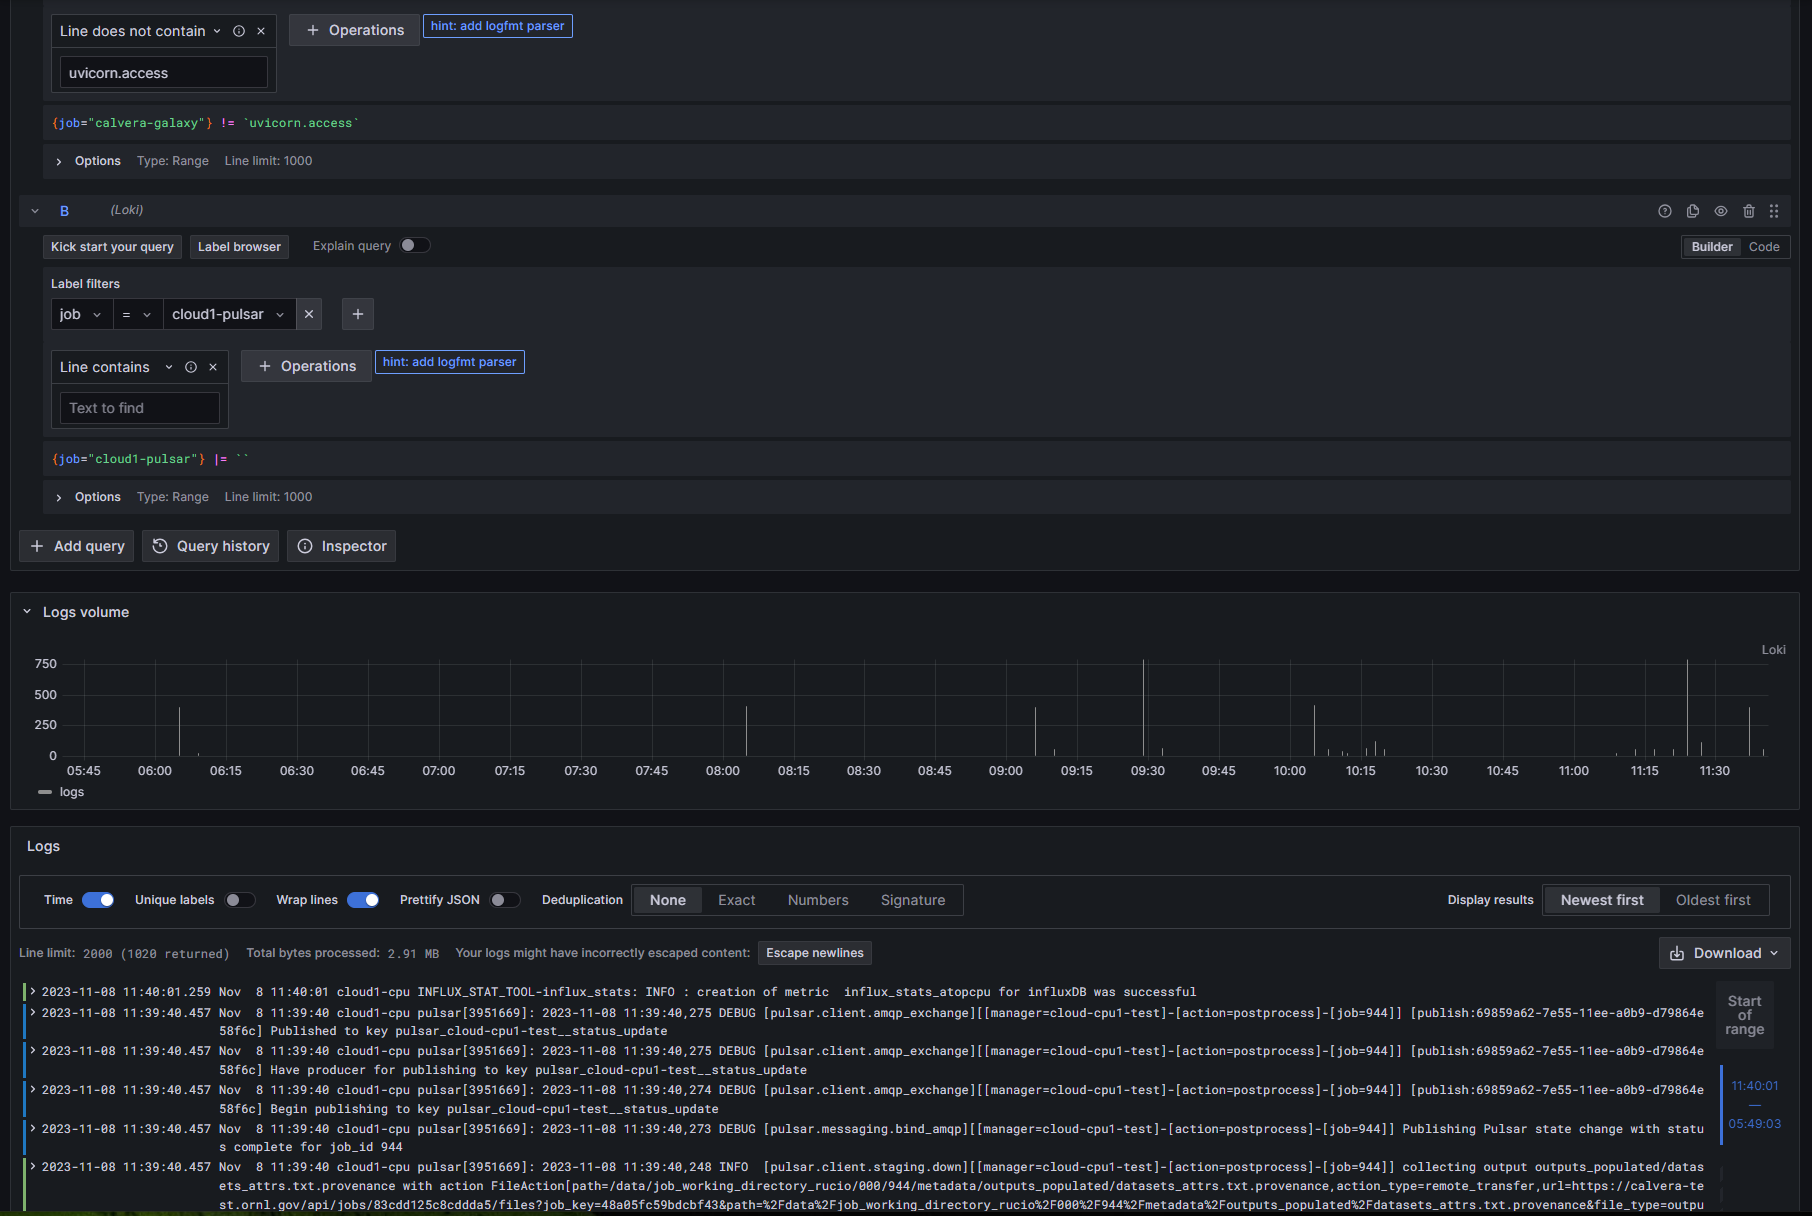
It is that simple. We can filter our new query, just like we did our first, and the filters will not interfere with one another. More importantly, we are getting a little more interesting data from the new logs. Note that little colored band on the left side of the log output now shows green and blue markings? This is even more interesting as we drill into the new output.

Loki has picked out ERROR, WARNING, DEBUG and INFORMATIONAL log lines and color-coded them for us.